"It was the best of times, it was the worst of times."
Charles Dickens wrote that about two cities, London and Paris, sitting on the edge of a revolution. It is also, oddly enough, the most accurate sentence anyone has written about AI data centers.
Here is the confusion I want to clear up today. Open one tab and you will read that AI is an environmental disaster, that it drinks rivers and burns coal and is dragging us backward on climate. Open another tab and you will read that AI hardware is breaking efficiency records the computer industry has never seen before. And here is the strange part: both of those tabs are citing real data. Both are right. The people writing them are not lying to you.
They are just looking at two different curves.
A note on the numbers
Every figure in this article was checked against the original research where possible, and the full source list is at the bottom. I flag the contested numbers on purpose, including one famous statistic that falls apart the moment anyone measures it. Being honest about the data is the whole point of this brand. If a number is debated, you deserve to know that before you repeat it.
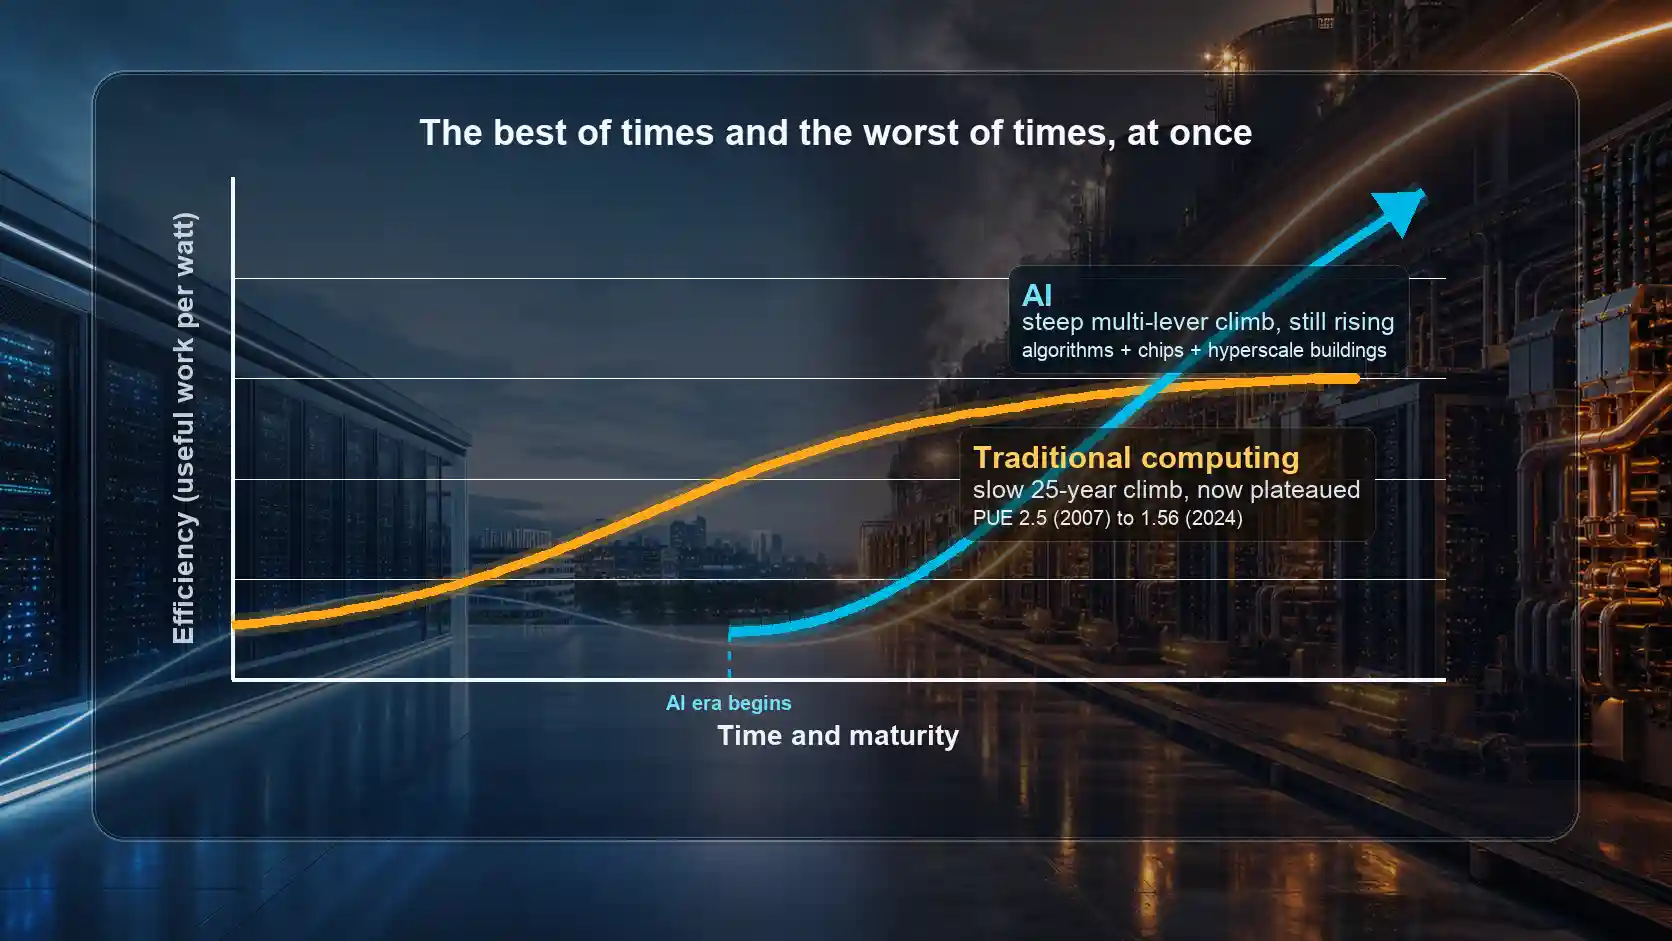
Every technology has an efficiency curve, a long arc that tracks how much useful work it squeezes out of each unit of energy over time. Traditional computing, the quiet machinery that has run the internet for the last twenty-five years, climbed its curve slowly, in private, over decades, and has now reached the top and stalled out. AI is climbing a second curve. That curve is steeper, it is moving faster than anything traditional computing ever managed, and the wild part is that AI is climbing it at the exact same moment it is making the biggest, dirtiest, most expensive mess of its entire existence.
Best of times. Worst of times. At the same time. That simultaneity is the whole story, and once you see it, the panicked headlines and the cheerleading headlines both fall into place.
So let me tell you a tale of two cities. The first is the data center you already know. The second is the one being built right now.
The First City: The Quiet Machine You Already Live In
Most people picture a data center as a cold room full of blinking servers, humming away, holding your photos and your email and last night's Netflix episode. For about twenty-five years, that picture was basically right. The data centers that built the modern internet were libraries. Their whole job was to store information and hand it out fast when somebody asked for it.
A library is busy, but it is not exhausting. The librarian finds your book, makes a copy, sends it out. The work is light. Most of the shelves just sit there most of the time. This is what computer people call a bursty workload. Demand spikes when a video goes viral at eight at night, then falls off a cliff at three in the morning, and the machines doze through the quiet hours.
Here is the part of this city's history that almost nobody tells you, and it is the foundation of everything that follows. For most of its life, this quiet machine was a spectacular energy hog.
We did not even have an agreed-upon way to measure data center efficiency until around 2007, when an industry group finally settled on a number called PUE, power usage effectiveness. The idea is simple. You measure all the electricity coming into the building, then you measure how much of it actually reaches the chips doing the work. A perfect score is 1.0, meaning every watt reaches the chips. When the Uptime Institute ran its first survey in 2007, the industry average PUE was 2.5.
Sit with that number. A PUE of 2.5 means that for every single watt of electricity that did real computing, another one and a half watts were burned just running the building around it. More than half the power went to overhead. The machine we now think of as lean and optimized spent the early part of this century wasting most of its electricity, and for the decades before 2007, nobody was even keeping score.
Then the long, unglamorous climb began. The industry average PUE fell to 1.98 by 2011, to 1.65 by 2014, and to 1.58 by 2018. And then it essentially stopped. The 2024 survey still puts the global average right around 1.56. The best new hyperscale facilities run close to 1.1, meaning almost every watt reaches the chips. But the industry as a whole has been stuck near 1.56 for more than five years, because all the easy wins are gone and what is left is expensive and slow.
That climb from 2.5 to the low 1.5s took the better part of fifteen years of hard engineering, sitting on top of decades of prior neglect. And it paid off in one of the great unsung achievements in tech, documented in a 2020 study in the journal Science by Masanet and colleagues. Between 2010 and 2018, the amount of computing done by the world's data centers grew by roughly 550 percent. More than a six-fold explosion in workload. And yet the electricity those data centers used barely moved, rising only around 6 percent over the same period.
Read that again. Six times the work, for almost the same power. They decoupled the work from the energy. How? Three structural moves, mostly. The chips finally learned to rest, throttling down when idle instead of guzzling power at every red light. The industry killed the closet, shutting down millions of wasteful little server rooms and consolidating the work into huge optimized campuses. And they moved data closer to you with caching networks, so the internet stopped shipping the same video across the planet a million separate times.
The takeaway for the first city
Traditional computing was not born efficient. It spent decades as a gas-guzzler, then spent fifteen more years grinding its way to the top of its efficiency curve. And it is now sitting at the top with nowhere left to go. The cushion is spent. There is no more slack in the system. Hold onto that, because it is exactly what the second city does not have to worry about yet.
The Second City: The Steel Mill That Thinks
The buildings going up for AI are not libraries. They are steel mills.
An AI data center is not storing your stuff for later pickup. It is running one enormous, white-hot industrial process, and it has to keep that process running flat out, day and night, for weeks or months at a stretch, to train a single model. You cannot let a steel mill idle between orders. You cannot cool it with a ceiling fan. And you cannot plug it into the same wall outlet you used for the library. This is the loud, hungry, visible city, and it is the one the scary headlines are about. They are not wrong. Let me show you why it is so different.
The brains are different. Traditional computing runs on the CPU, a brilliant generalist that does one complicated thing at a time, incredibly fast, like a master chef plating one perfect dish before starting the next. AI runs on the GPU, which is the opposite. It is thousands of simple workers all doing the same basic arithmetic at the same instant, like a stadium full of people each solving one easy multiplication problem at once. No single worker is impressive. Together they are unstoppable. AI needs the stadium because underneath the magic, a model is just multiplying gigantic grids of numbers, millions of them, all at the same time.
The power draw is different. A normal server rack draws 5 to 10 kilowatts, a handful of household appliances. A modern AI rack draws 40 to 100 kilowatts, and the flagship systems shipping right now already exceed 120 kilowatts in a single rack. The next generation, arriving in 2027, is being designed for 600 kilowatts per rack. That is the electricity of roughly 500 homes, packed into one steel cabinet about seven feet tall and two feet wide. In the first city, the limit was floor space. In the second city, floor space is the easy part. The limit now is whether the local power grid can physically deliver enough electricity to the building at all.
The cooling is different. Cram that much power into that little space and it gets hot. Not warm, hot. Above roughly 40 kilowatts per rack, moving air simply cannot carry the heat away fast enough. It is like trying to cool a campfire by waving a magazine at it. So AI data centers switched to liquid, running chilled fluid through pipes that touch the silicon directly, or in the extreme version, dunking entire servers into tubs of special non-conductive fluid. It sounds wild the first time you hear it. It is now standard, because physics left no other option.
The traffic flows differently, and the power comes from somewhere new. In the first city, data flows outward, from the building to you. In the second city, the important traffic flows sideways, between thousands of chips that constantly compare notes so the whole cluster behaves like one giant brain. And because a single large AI facility can demand anywhere from 100 megawatts to a full gigawatt, roughly the output of a nuclear reactor, these campuses increasingly bring their own power, building next to nuclear plants or installing their own gas turbines and battery farms because the grid cannot keep up.
This is the worst-of-times city. It is real, it is enormous, and it is the part everyone sees. But it is only half the tale, because this same loud, hungry machine is also climbing an efficiency curve faster than any computer in history.
How the Second Curve Got So Steep
To understand why AI's efficiency curve is so much steeper than the first city's, you have to know that AI got here by breaking the rules of computing that held for forty years.
For decades, two reliable laws governed progress. Dennard scaling said that as you shrink transistors, the power packed into a given area stays about the same, so smaller chips ran cooler. Koomey's law said the computing you get per unit of energy roughly doubles every year and a half or two. Around 2005, Dennard scaling quietly died. Transistors got so small that electricity began leaking across them even when switched off, like a faucet that drips no matter how hard you crank the handle. The leaking made heat the industry could not shed, and chip speeds slammed into what engineers call the power wall. If you ever wondered why your laptop's raw speed stopped climbing the way it did in the 1990s, that is why. CPUs have been stuck around 4 to 5 gigahertz ever since.
GPUs got around the wall by rethinking the chip itself. A CPU spends most of its silicon on complex control machinery and large memory caches, all the overhead needed to juggle unpredictable one-at-a-time tasks, so only a small slice actually does math. A GPU throws most of that overhead out and fills the freed-up space with thousands of simple math units. Since AI is nothing but the same math repeated billions of times, that trade is wildly efficient. Then engineers found a second trick. Traditional computing demands perfect precision, hauling numbers around in big exact 32-bit and 64-bit chunks, because a bank cannot round off a penny. AI turned out not to need that. A neural network is fuzzy by nature, the way a recipe tolerates a pinch instead of an exact gram. So designers built units that do the math in much smaller 16-bit or even 8-bit chunks. Going from 32-bit to 8-bit shrinks the data moving through the chip by 75 percent, and the energy drops right along with it.
But the chips are only one of three levers, and this is the heart of the whole thesis, so let me give you the analogy that makes it click.
Think of training an AI like baking at an industrial scale. You can get more efficient in three different ways. You can improve the kitchen, meaning the building and its cooling and power, which is the PUE we just talked about. You can improve the oven, meaning the chips themselves. Or you can improve the recipe, meaning the actual math and methods used to train the model. The first city, traditional computing, really only ever improved the kitchen. That is what the whole PUE story was about. One lever, pulled slowly, over fifteen years.
AI is pulling all three levers at once, and every one of them is moving faster than the first city's single lever ever did.
The kitchen lever, PUE, AI gets for free, because it runs in those same modern hyperscale buildings already pushing toward 1.1. The oven lever, the chips, is improving at roughly 40 percent a year in useful computing per watt, far faster than the old Koomey's law pace. And the recipe lever, the algorithms, is where the truly stunning numbers live, and they come from peer-reviewed research, not press releases.
Researchers at OpenAI showed back in 2020 that the computing needed to reach a fixed level of AI performance was cutting in half roughly every 16 months, a 44-fold improvement over seven years, already beating the historic pace of Moore's law. A 2022 study presented at a peer-reviewed conference tightened that to about every 9 months for vision systems. And a 2024 study published at NeurIPS, one of the most rigorous venues in the field, measured language models specifically and found the compute needed for a given performance level was halving roughly every 8 months, adding up to a cumulative algorithmic efficiency gain on the order of 22,000 times between 2012 and 2023.
I want to be honest with you about that 22,000 figure, because being honest about your numbers is the whole point of this brand. A 2025 paper argued that once you correct for some statistical bias, the true algorithmic gain might be closer to one-tenth of that. So the exact magnitude is genuinely debated. But the direction is not in dispute across any of these studies. The recipe is getting dramatically better, fast.
Now put the levers together, because the OpenAI researchers made a point most coverage misses entirely. These gains multiply. They do not just add. A better oven and a better recipe and a better kitchen, all improving at once, compound on top of each other.
The first city climbed one lever, the kitchen, slowly, over roughly twenty-five years, and is now stalled at the top. The second city is climbing three levers at once, every one of them faster than the first city's single lever, and it is doing it in its very first decade of existence.
The two curves, side by side.
The Trick of Timing, and Why Everyone Is Talking Past Each Other
Here is the dot that almost no one connects, and it is the reason the AI energy conversation is such a mess.
Traditional computing got to have its ugly, wasteful adolescence in private. Through the late 1990s and the 2000s, when data centers were burning more than half their power on overhead, nobody was watching. There were no viral threads about it. There was not even an agreed-upon way to measure the waste until 2007. The first city got to be a gas-guzzling teenager in a garage where no one could see, and it only stepped into the public eye years later, after it had already started cleaning up its act. By the time most people thought about data centers at all, the efficiency miracle was already underway.
AI does not get that privacy. AI is doing all of its growing up on stage.
Its messiest, hungriest, least optimized phase, the giant buildout, the 600 kilowatt racks, the gigawatt campuses, the water draw, is happening at the exact same time as its record-shattering efficiency gains, and all of it is unfolding in full public view, measured to the watt, reported quarterly, argued about daily. The inefficiency and the efficiency are not happening in sequence, the way they did for the first city. They are happening simultaneously.
This is why the two tabs disagree
The person writing the catastrophe story is standing at the bottom of the curve, looking at the raw size of the buildout, and everything they see is real. The person writing the efficiency story is measuring the slope of the curve, watching how fast AI is improving, and everything they see is real too. They are both staring at the same machine at the same moment, describing two different true things about it, and neither one has noticed that the other is also right.
Best of times. Worst of times. At the same time. Dickens would have understood AI data centers perfectly.
But the Curve Is Not the Whole Story
Now, if I stopped here, I would be doing exactly the thing I just criticized, telling you only the half of the tale that flatters the technology. So let me close the loop honestly, because a steep efficiency curve does not automatically mean a smaller footprint, and pretending otherwise would be its own kind of dishonesty.
There is a trap waiting at the top of every efficiency curve, and it has a name: Jevons' paradox. When you make a resource cheaper and more efficient to use, people do not use less of it. They use far more. When engines got more fuel-efficient, we did not burn less fuel, we drove more and built bigger machines. That is precisely what is happening with AI. Even as the cost per calculation plummets, the total amount of computing thrown at frontier models is growing by about 4.1 times every year, according to the research group Epoch AI. Efficiency is climbing fast. Demand is climbing several times faster. The savings get swallowed whole.
So the absolute footprint is real, and it deserves a clear-eyed accounting. Three honest notes on it.
On energy, be careful with the famous statistic that an AI query uses ten times more electricity than a web search. That number traces back to a single offhand executive comment from 2023 stacked on a Google figure from 2009, and when researchers actually measured it, a typical text question came out around 0.3 watt-hours, roughly the same as a search, not ten times more. The real cost shows up only on heavy tasks like image generation, deep reasoning, or analyzing long documents, which can run 2.5 to 40 watt-hours. The honest version is this: your quick question is cheap, the heavy lifting is not, and the planetary scale of billions of those heavy tasks is the actual concern. This is the same pattern of recycled, unchecked claims I dug into in the piece on AI layoffs and AI-washing.
On water, the concern is more solid. A 2026 study in Cambridge Prisms: Water examined an AI hub in the São Paulo region of Brazil running a 550 megawatt computing load, and estimated it consumes about 16.1 million cubic meters of water a year, comparable to the needs of more than 100,000 households. Nearly half of that is virtual water, evaporated back at the hydroelectric reservoirs that feed the grid, so the facility drains the regional water supply twice over, and it keeps drawing even during droughts when the community can least spare it.
On carbon, there has been a real step backward. For more than a decade the big tech companies were the world's leading corporate buyers of clean energy, genuinely pulling the grid greener. The AI rush reversed that, because a clean power plant can take five to seven years to approve and connect while an AI data center goes up in twelve to eighteen months. So companies are bridging the gap with on-site natural gas and by paying utilities to keep aging fossil plants running past retirement, which slows the cleanup of the grid those same companies had been speeding up.
The Bottom Line
The tale of two cities leaves us with a technology that refuses to fit into a single headline, because it is honestly living two stories at once.
The first city, traditional computing, shows us what a finished efficiency curve looks like: a slow, private, decades-long climb up a single lever, ending in a plateau with the easy gains used up. The second city, AI, is something genuinely new. It is climbing a steeper curve on three levers at once, faster than any computer in history, in its very first decade, in full public view, while simultaneously making the largest and least efficient buildout mess the industry has ever produced.
That is not a contradiction. It is a maturation story playing out in fast-forward and on stage, instead of slow and in private. The water headlines are describing the bottom of the curve. The efficiency headlines are describing its slope. Both are true, and the only real mistake is mistaking one for the whole picture.
The most useful thing any of us can do is hold both halves at the same time. Take the genuine costs seriously, the water and the carbon especially, and check the scary statistics before repeating them, because some of the loudest ones fall apart the moment anyone measures them. And at the same time, give the curve its due. AI reached, in ten years, efficiency improvement rates that traditional computing needed thirty to find, and it is still accelerating.
Understanding your AI means being able to see both of those facts standing side by side, the best of times and the worst of times, and not flinching from either one.
Efficiency and Energy Research
- Masanet, E., Shehabi, A., Lei, N., Smith, S., & Koomey, J. (2020). "Recalibrating global data center energy-use estimates." Science, 367(6481), 984 to 986. DOI: 10.1126/science.aba3758. Source of the finding that computing grew roughly 550% from 2010 to 2018 for about 6% more energy.
- Uptime Institute. Global Data Center Survey (2018 through 2024). Source of the PUE history: 2.5 in 2007, 1.98 in 2011, 1.65 in 2014, 1.58 in 2018, and a plateau near 1.56 since.
- Epoch AI. "Training Compute of Frontier AI Models Grows by 4 to 5x Per Year" and "How Much Energy Does ChatGPT Use?" Sources for the 4.1x annual compute-growth figure and the corrected per-query energy estimate.
Algorithmic Progress Research
- Hernandez, D., & Brown, T. B. (2020). "Measuring the Algorithmic Efficiency of Neural Networks." OpenAI. arXiv:2005.04305. Algorithmic efficiency doubling roughly every 16 months, a 44x gain in 7 years, faster than Moore's law, plus the finding that hardware and algorithmic gains multiply.
- Erdil, E., & Besiroglu, T. (2022). "Algorithmic progress in computer vision." IJCNN. arXiv:2212.05153. Doubling roughly every 9 months for vision systems.
- Ho, A., Besiroglu, T., Erdil, E., Owen, D., Rahman, R., Guo, Z. C., Atkinson, D., Thompson, N., & Sevilla, J. (2024). "Algorithmic progress in language models." NeurIPS. arXiv:2403.05812. Compute to reach a fixed performance halving roughly every 8 months, with cumulative algorithmic gains on the order of 22,000x from 2012 to 2023. Note: the magnitude of this figure is debated by later work.
Water, Carbon, and Infrastructure
- Liang, G. (2026). "The Cloud's Thirst: Quantifying AI's Water Footprint and its Impact on the Water-Energy Nexus in São Paulo, Brazil." Cambridge Prisms: Water. DOI: 10.1017/wat.2026.10020. Source of the São Paulo water figures.
- Hankendi, C., Coskun, A. K., & Sovacool, B. K. (2025). "Why Transparency Matters for Sustainable Data Centers and Carbon-Neutral Artificial Intelligence (AI)." iScience, 28(11), 113705. DOI: 10.1016/j.isci.2025.113705.
- Pilz, K. F., Sanders, J., Rahman, R., & Heim, L. (2025). "Trends in AI Supercomputers." arXiv:2504.16026. AI supercomputer performance doubling roughly every nine months.
- Patel, A., Mahalingam, N., & Patel, R. (2026). "The Environmental Impact of AI Servers and Sustainable Solutions." arXiv:2601.06063. Preprint, not yet peer reviewed.
- Todd, A., et al. (2021). "Artificial Intelligence for Data Center Operations (AI Ops)." US Department of Energy, OSTI. DOI: 10.2172/1783088.
Companion Articles from Understanding Your AI
Where does your team actually stand with AI?
Stop guessing. The free AI Readiness Assessment takes a few minutes and gives Tim what he needs to point you at your highest-value next step, whether or not you ever hire us. We serve Midland, Bay City, Saginaw, and Michigan's Great Lakes Bay Region with research-backed AI training and fractional AI leadership.