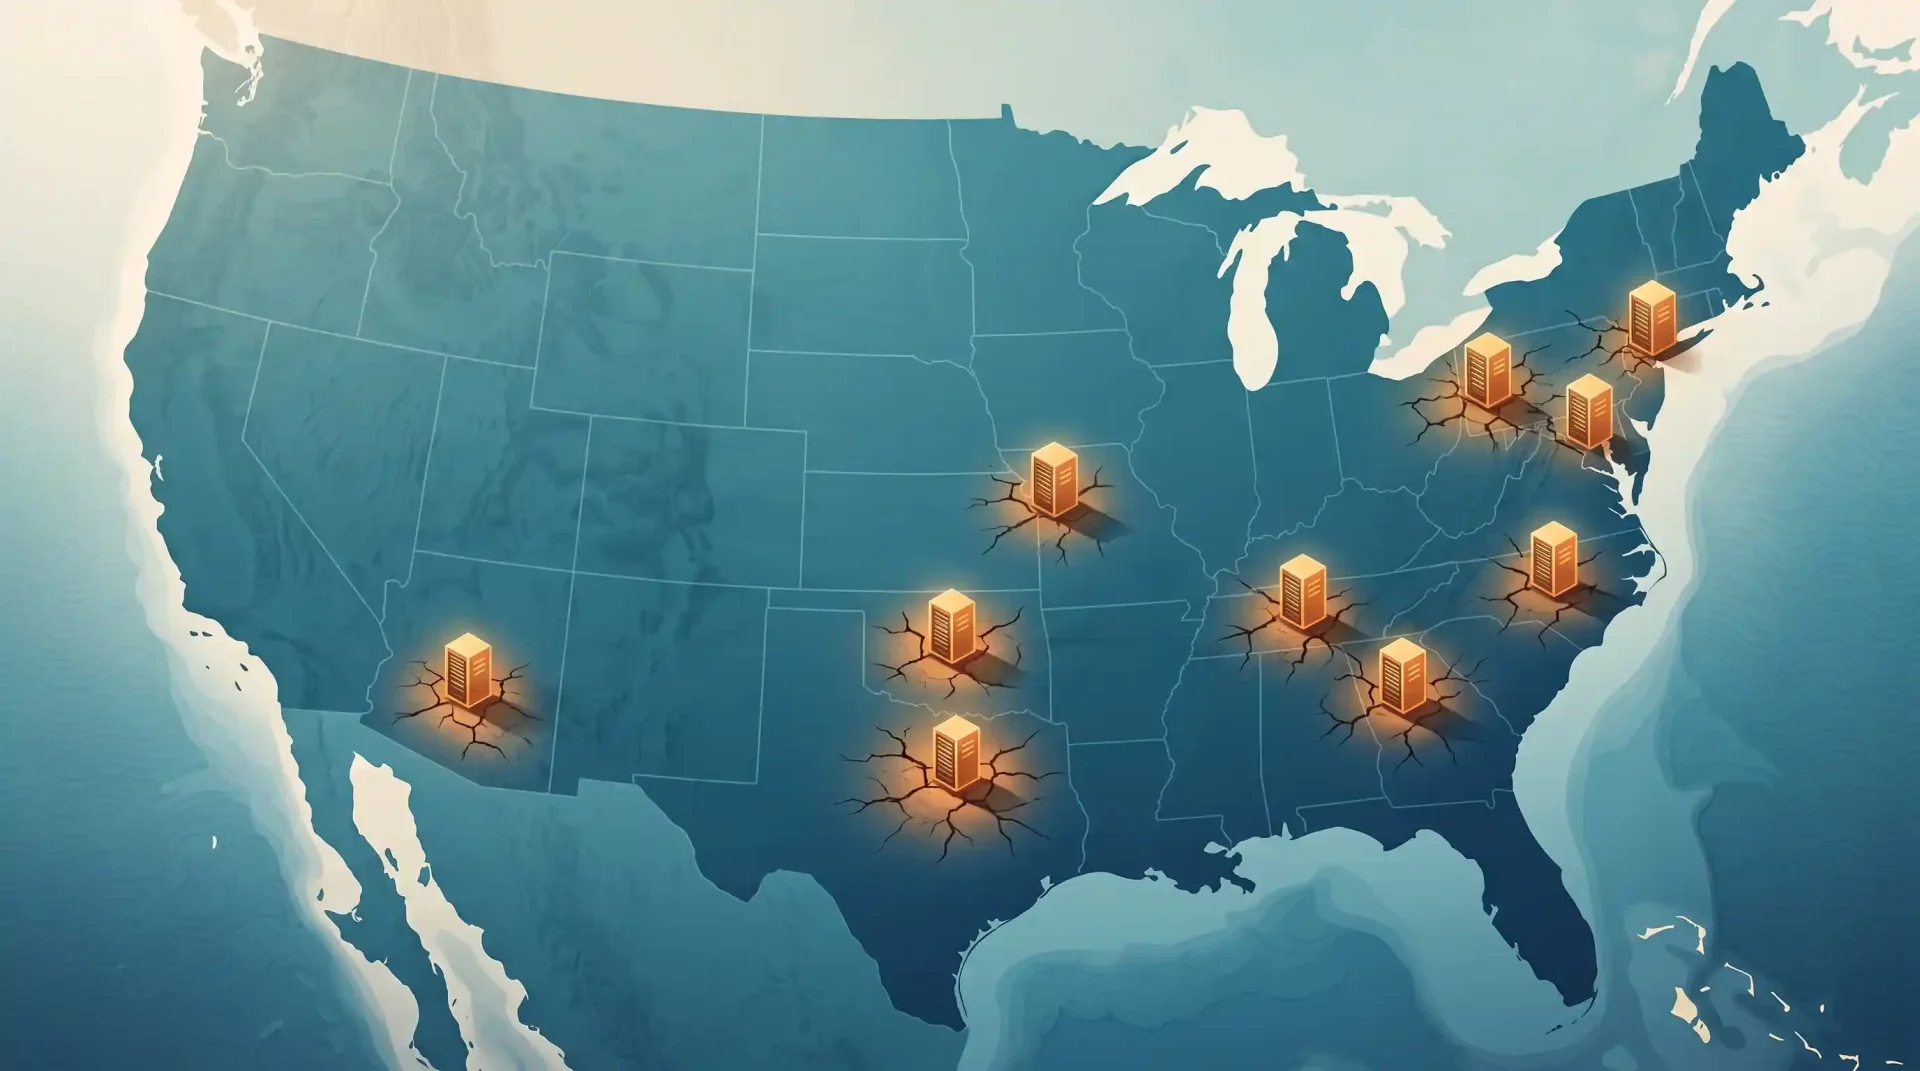
Will AI Data Centers Drain America Dry?
Nationally, the math says no, and it isn't close. Locally, in a specific list of counties, the fight is already underway, and has been for a while. Here's the water math the panic headlines skip, the efficiency curve almost nobody is tracking, and the ten places feeling it first.
Somebody in your feed has probably told you a data center is about to drink their town dry. Somebody else has told you the whole thing is a manufactured panic and data centers use less water than golf courses. I already handled the "10 gallons per image" version of this fight in February. That claim was a myth. This one is not as simple, and pretending it is would be its own kind of dishonesty.
The honest version has two different, true answers depending on which map you're looking at. Zoom out to the whole country and the numbers are almost boring. Zoom into Loudoun County, Virginia, or Fayette County, Georgia, or the Memphis Sand Aquifer, and they are not boring at all. Both of those things are true at the same time, for the same reason my "Two Curves" piece described back in May: water, like electricity, doesn't distribute itself evenly, and a number that looks tiny nationally can be enormous to the one utility that has to actually deliver it.
A note on the numbers
Every figure below is sourced at the bottom, and I'm flagging the contested ones on purpose. The single biggest one: independent researchers can't agree on how much water data centers use indirectly, through the power plants generating their electricity. One federal-adjacent estimate puts that indirect number at roughly twelve times the direct cooling number. A separate industry research firm puts the same ratio closer to two and a half times. Both can't be precisely right, and I'm not going to pretend one of them is settled science just because it makes a cleaner headline. Where the research disagrees, you'll see both numbers here, not the scarier one dressed up as consensus.
811 trillion gallons of renewable freshwater the U.S. has access to annually (FAO/World Bank)
17.4 billion gallons U.S. data centers directly consumed for cooling in 2023 (Berkeley Lab)
1.8 L/kWh the industry's average water efficiency in 2016, and still the average a decade later
58% of Loudoun County's data centers now cooled with reclaimed water instead of drinking water
How Much Water the Country Actually Has
Start with the number almost nobody quotes correctly: the U.S. isn't short on freshwater in aggregate. The most recent full USGS accounting puts total water withdrawals, every use combined, agriculture, power generation, industry, households, at 322 billion gallons a day, with 281 billion gallons a day of that specifically fresh (not saline) water. That figure is from 2015; USGS runs the full survey every five years and is releasing the 2020 update by category rather than as one consolidated number, so 2015 remains the last complete national total.
Against that withdrawal figure, the country's renewable freshwater base, precipitation plus runoff plus aquifer recharge, runs about 3,069 billion cubic meters a year according to FAO and World Bank data, or roughly 811 trillion gallons. Divide one into the other and the U.S. currently withdraws about 12.6% of its renewable supply each year, which tracks with the FAO's own water-stress figure for North America of 12.3%, low next to Northern Africa's 121% or South Asia's 76.7%.
That's the whole picture in one sentence: nationally, the U.S. has roughly eight times more renewable freshwater than it withdraws for everything, combined, every year. Data centers are a rounding error against that backdrop, which is the first thing that gets lost in every viral thread on this topic.
How Many Data Centers We're Actually Talking About
Here's a confession before the numbers: no two trackers agree on a single count, and any source handing you one clean figure without a caveat is oversimplifying. Broad trackers counting every facility, down to small enterprise server rooms, land around 4,000 to 5,400 for 2026. Statista counted 4,423 as of April 14, 2026. Data center mapping firm dcmap.us counted 4,800 across every lifecycle stage as of July, broken into 3,687 operational, 229 under construction, and 857 planned. Trackers that only count large-scale hyperscale and colocation campuses report far fewer, closer to 1,200, because they're counting campuses instead of individual buildings within them.
The industry itself doesn't cleanly separate "AI" facilities from "traditional" ones physically anymore, since most modern builds mix workloads on the same site. Capacity is the more honest proxy, and here's the update to my February piece: back then, AI represented roughly 15 to 20% of data center energy. That was five months ago. As of this year, U.S. data center capacity splits roughly 44 gigawatts for AI workloads against 38 gigawatts for everything else, meaning AI-driven capacity has already caught up to, and likely passed, traditional computing as the larger power draw. The Federal Energy Regulatory Commission's March 2026 State of the Markets report confirmed just over 50 gigawatts of total U.S. data center capacity, up 24% annually (compound) since 2020. Globally, there were about 1,297 operational hyperscale data centers as of late 2025, and the U.S. holds roughly 54% of that worldwide hyperscale capacity.
What's still coming dwarfs what's already built. dcmap.us counts 857 planned projects plus 229 under construction. A separate capacity-focused tracker, Cleanview, counts 1,733 planned projects that would add 375,421 megawatts on top of the 57,501 megawatts already operating, a roughly sevenfold jump in announced capacity, though realistically only a fraction of that gets built on the timeline announced. Treat that pipeline number as a ceiling, not a forecast.
What Data Centers Are Actually Drinking Right Now
The most credible independent figure comes from Lawrence Berkeley National Laboratory's 2024 U.S. Data Center Energy Usage Report: U.S. data centers directly consumed 17.4 billion gallons of water in 2023 for on-site cooling. That's the number every headline quotes. It's also the smaller number.
The 176 terawatt-hours of electricity data centers drew in 2023 required an estimated 800 billion liters, roughly 211 billion gallons, of water at the power plants generating it. That's the indirect footprint, and per Berkeley Lab's own accounting, it ran about twelve times larger than the direct cooling figure everyone quotes. Add both together and you land near 228 billion gallons for the full 2023 U.S. data center water footprint, direct and indirect combined. (This is the contested ratio flagged above. A separate 2026 industry analysis from Bluefield Research puts the indirect-to-direct ratio closer to two and a half to one rather than twelve to one. Neither has been reconciled with the other publicly, which itself tells you how immature this measurement science still is.)
Company disclosures, where they exist, land in a comparable range once you adjust for scope. Google reported 6.4 billion gallons company-wide for 2023. Microsoft reported roughly 1.7 billion in its most recent disclosure, up about 34% year over year. Meta reported 813 million for 2023. Amazon didn't disclose a global total until 2025, when it reported 2.5 billion gallons for the year, alongside a claim of running about seven times more water-efficient per unit of electricity than the industry average it cited for comparison.
The Efficiency Curve Nobody Is Tracking
"Two Curves" told the PUE story in detail: the industry-wide power efficiency metric, born in 2007 at an embarrassing average of 2.5 (meaning more than half of every watt was wasted on overhead), ground its way down to 1.98 by 2011, 1.65 by 2014, 1.58 by 2018, and has been stuck near 1.56 ever since, per the Uptime Institute's own survey. Best-in-class hyperscale facilities run close to 1.1. That took the better part of eleven years of hard engineering to reach today's plateau.
Water has its own version of that metric, and its story is stranger. Water Usage Effectiveness, or WUE, measured in liters of water per kilowatt-hour of IT energy, was introduced by The Green Grid in 2011, four years after PUE. A 2016 Lawrence Berkeley National Laboratory study measured the U.S. industry average at 1.8 liters per kilowatt-hour. That's the same number cited across the industry today, a decade later. Multiple 2025 and 2026 sources, including trade publications and sustainability guides, still list the average as sitting between 1.8 and 1.9 L/kWh. Unlike PUE, which climbed steadily for over a decade after it was defined, the industry-wide WUE average has barely budged since the year it was first seriously measured. Nobody optimized for it the way they optimized for power, because for most of the last decade, water was cheap and unmetered attention wasn't on it.
Here's where it gets genuinely interesting, and where the two curves finally reconnect. AI didn't fix that plateau on purpose. It bypassed it by accident, for a completely unrelated reason: heat. A traditional server rack draws 5 to 10 kilowatts. Nvidia's current flagship AI systems draw 120 to 132 kilowatts per rack, with the next generation arriving in 2027 designed for up to 600 kilowatts. At that density, air simply can't carry the heat away, full stop, so AI infrastructure has had no choice but to switch to direct-to-chip liquid cooling in closed loops. That switch, made purely for thermal survival, happens to also collapse the historic tradeoff between PUE and WUE. Older facilities that chased a great PUE score usually did it with evaporative cooling towers, which meant a worse WUE score. Facilities that avoided water with pure air cooling usually paid for it with a worse PUE, especially in hot climates. Liquid cooling breaks that tradeoff: current best-in-class figures show WUE near zero alongside PUE of 1.05 to 1.2, both good, at the same time, in facilities that are only a few years old. AWS reports a global average of 0.15 L/kWh. Meta reports figures as low as 0.20 to 0.24 L/kWh. Microsoft's fleet average is 0.27 L/kWh, though that masks huge regional variation, 0.02 to 0.03 L/kWh in Singapore and parts of EMEA against a rough 1.52 L/kWh at its Arizona sites, where desert heat forces heavier evaporative assistance even in an otherwise efficient fleet.
So: it took the traditional industry roughly a decade of dedicated engineering effort to move PUE meaningfully, and its WUE average never moved at all in that same window. New AI-native facilities are hitting best-in-class numbers on both metrics within a handful of years of construction, not as a sustainability initiative, but as a side effect of needing liquid cooling to avoid melting the chips. That's a genuinely faster curve, and it's worth taking seriously.
It's also not the whole story, and repeating only this half would be exactly the mistake I called out in "Two Curves." A low WUE ratio doesn't automatically mean less water in absolute terms, because the denominator, total energy draw, is exploding at the same time. Run the numbers yourself: a traditional 5 to 10 kilowatt rack at the old industry-average WUE of 1.8 L/kWh uses roughly 9 to 18 liters of water an hour. A modern 120-kilowatt AI rack at a best-in-class WUE of 0.2 L/kWh, nine times more water-efficient per kilowatt-hour, still uses about 24 liters an hour, because it's drawing twelve to twenty-four times more power through that far better ratio. The efficiency win is real. The absolute footprint per rack can still go up, not down, because scale outran the efficiency gain. That's Jevons' paradox again, the same trap "Two Curves" flagged for energy, showing up in the water numbers too.
If Every Announced Project Gets Built
Treat any single 2030 figure with real suspicion, because the three most credible projections available don't agree with each other, and the disagreement itself is informative.
Berkeley Lab's own 2028 outlook: direct cooling water for all U.S. data centers could reach 38 to 73 billion gallons a year, with hyperscale facilities specifically accounting for 16 to 33 billion of that. A 2026 paper out of UC Riverside, Caltech, and Rochester Institute of Technology, "Small Bottle, Big Pipe," projects that under a baseline 2030 scenario, U.S. data centers could withdraw 80 to 150 billion gallons and consume 60 to 110 billion gallons a year for direct cooling alone, which the authors calculate at 0.6 to 1.1% of everything U.S. public water systems withdraw annually. Bluefield Research's February 2026 "Water-Power Nexus" report projects direct cooling water climbing from 22 billion gallons in 2025 to 34 billion by 2030, and indirect water from electricity climbing from 54 billion to 91 billion over the same stretch, landing near 125 billion gallons combined by 2030.
What all three agree on matters more than any single total: the annual number isn't the real constraint, the peak day is. The UC Riverside and Caltech researchers found that daily demand from evaporative cooling can spike to six to ten times the annual average during hot weather, since these systems work hardest exactly when it's hottest and driest, and for some individual planned facilities that multiple exceeds thirty. A large site can already withdraw more than a million gallons on a single hot day, and some facilities under construction have been allocated up to 8 million gallons daily. Scaled across the announced pipeline, researchers estimate U.S. water systems would need 697 million to 1.45 billion gallons a day of new peak capacity by 2030, comparable to adding a second New York City's entire daily water supply, at an infrastructure cost of $10 billion to $58 billion depending on how fast the buildout runs and whether efficiency keeps improving.
So, Will We Run Out?
No, not nationally, not even under the most aggressive number on this page. The high end of the most aggressive 2030 projection, 150 billion gallons of direct withdrawal a year, still lands under 1.5% of the freshwater the country withdraws today for everything else combined, and it's a rounding error against the 811 trillion gallon renewable base. If your only question is "will America run dry because of server farms," the answer is a clean no, and anyone telling you otherwise at the national level is selling something.
But "national supply" was never really the right frame, and this is where the myth-busting cuts the other direction. Water doesn't move around the country the way electricity does on a grid. A facility in drought-stricken Georgia cannot borrow surplus from the Great Lakes. Every case below shows the same mechanism: a facility that's statistically invisible in the national numbers becomes 10% of a county's entire water budget, or a multi-million-gallon daily peak draw on a system sized for a much smaller town. That's a permitting and siting fight, not a supply crisis, and it's already being litigated county by county.
The Ten Places Already Feeling It
I built this list from documented gallons, percentage of local water supply consumed, drought overlap, and the quality of public disclosure available, not from a single ranked source, because no such ranking exists yet. These are the ten places with the clearest paper trail right now.
1. Loudoun County, Virginia. Home to Data Center Alley, the densest concentration of data centers on Earth and an estimated 70% of global internet traffic passing through it daily. Loudoun's roughly 200 data centers used between 900 million and 1.6 billion gallons of water in 2023 depending on the source, and all of Virginia's data centers together used about 2.1 billion gallons that year, a 63% jump from 2019. The utility, Loudoun Water, says data centers currently make up about 15% of its total water use, and to its credit, has moved about 40 of those 200-plus facilities onto reclaimed water instead of drinking water, roughly 700 million gallons a year now diverted from the potable system. Regionally, projections for the greater Washington metro area show data center peak-day water demand growing from 14.3 million gallons in 2025 to 58 million gallons by 2035, with data centers' share of the region's total water rising from 8% to 25% over that same decade.
2. Metro Atlanta and rural Georgia. Metro Atlanta is the country's second-largest data center market by megawatts built, trailing only Northern Virginia, and it's building that footprint while the state sits under a drought emergency declared by Governor Brian Kemp. In Fayette County, residents noticed dropping water pressure before regulators discovered a Blackstone and QTS data center campus, known as Project Excalibur, drawing more than 29 million gallons through unauthorized connections. In Newton County, a single data center that opened in 2018 uses about 500,000 gallons a day on its own, roughly 10% of the entire county's water consumption.
3. Texas, statewide. The Houston Advanced Research Center found the state's 464 existing data centers, with 70 more under development as of its January 2026 report, already consume about 25 billion gallons a year combined, direct and indirect. That could climb to 29 to 161 billion gallons by 2030, up to 2.7% of the state's entire water use, and HARC's own paper flags that the Texas State Water Plan doesn't currently account for data center growth at all.
4. Northern Nevada. The Tahoe-Reno Industrial Center, a business park larger than the city of Detroit, hosts Google, Switch, Tract, Novva, and an expanding Microsoft footprint in one of the driest states in the country, roughly 10 inches of annual precipitation, a third of the national average. Google's Henderson facility alone used about 352 million gallons in 2024. The Desert Research Institute projects combined electricity-related and direct cooling water demand at the industrial center could reach the equivalent of tens of thousands of households' annual use by 2033. Every gallon drawn from the Truckee River is a gallon that doesn't reach Pyramid Lake, the traditional and spiritual home of the Pyramid Lake Paiute Tribe. Industry representatives, for their part, note that Reno and Sparks' three current facilities combined use roughly the water of 24 households today, a genuinely small current footprint next to a much larger projected one, and that gap between "now" and "2033" is exactly the tension driving Reno's current data center moratorium.
5. Salt Lake Valley, Utah. The NSA's Bluffdale facility alone consumed more than 126 million gallons between October 2024 and September 2025. Aligned Data Centers used 80 million gallons in West Valley and 47.4 million in West Jordan over that same twelve months, all in a state managing chronic Colorado River Basin stress.
6. Central and southern Arizona. Pima County regulators cited a Tucson-area data center developer in May 2026 for using restricted public water for dust suppression without proper authorization. Microsoft's own disclosures show its Arizona sites running the worst water efficiency in its entire fleet, 1.52 L/kWh, roughly fifty to seventy-five times worse than its coolest-climate sites, because desert heat forces heavier evaporative cooling even at an otherwise efficient operator. Arizona is also part of the five-state Southwest bloc, Arizona, Colorado, Nevada, New Mexico, and Utah, that Western Resource Advocates projects could collectively use 7 billion gallons of data center water a year by 2035.
7. Memphis, Tennessee. Memphis is the largest U.S. city that relies entirely on groundwater, the Memphis Sand Aquifer, for every drop of its residential, industrial, and agricultural water, and that aquifer is losing water faster than it recharges. xAI's Colossus supercomputer complex currently draws roughly 812,500 gallons a day from that aquifer, on top of at least 25 million gallons purchased from the city utility in a single month this spring, with peak needs projected as high as 13 million gallons a day once fully built out. To its credit, xAI is building an $80 million water recycling plant that will draw treated wastewater, water that would otherwise flow into the Mississippi River, rather than fresh aquifer water, and the company has said it plans similar reuse for its second Colossus facility. The fight here isn't really about total volume; it's about a single-source aquifer city hosting one of the largest AI training clusters on Earth, in neighborhoods, Boxtown, Westwood, that are also contending with air quality complaints from the gas turbines powering the site.
8. The Dalles, Oregon. Google has operated here since 2006, and in 2024 alone withdrew 461.1 million gallons and consumed 361.4 million of it (78%), by the company's own reporting, after a 13-month legal fight to keep those numbers confidential ended in 2023. Depending on the year and source, Google's operations account for roughly a third to 40% of the entire town's water usage. A pending federal bill, the Dalles Watershed Development Act, would transfer public land to expand the town's reservoir, a move regional tribes and environmental groups fear is really about securing more water for future data center growth rather than the town's stated population needs, at the expense of Columbia River salmon runs.
9. Greater Des Moines, Iowa. Microsoft's five data center campuses in West Des Moines use 2 to 7% of that city's water monthly, a six-year average of 2.1%, according to the utility's own figures. A few miles away in Altoona, Meta's campus uses up to 16% of that smaller town's entire water supply, a sharp reminder that impact varies enormously even between neighboring towns in the same metro. Google's Council Bluffs complex, meanwhile, consumes more than 1 billion gallons a year, the single largest water draw of any Google data center location worldwide, sitting on a favorable Missouri River floodplain aquifer. Iowa's state geologist has publicly flagged that some area data centers are drawing from deep aquifers holding water thousands of years old, water that, once withdrawn, effectively isn't coming back on any timescale that matters.
10. North Carolina, statewide. As of spring 2026, more than 97% of the Southeast United States was in some level of drought, the largest extent recorded since the U.S. Drought Monitor began tracking conditions in 2000, and North Carolina's own drought map showed the entire state affected. Raleigh activated Stage 1 water restrictions in April as Falls Lake, its primary drinking source, sat below normal for the season, the same month legislators advanced a bill, Senate Bill 730, that would direct state regulators to require closed-loop or reclaimed-water cooling and ban evaporative cooling systems for new data centers where needed. Not every North Carolina story is alarming, though: officials in Catawba County, weighing new Microsoft facilities, project that once fully built those sites will use only about 1% of the local utility's daily water production capacity, a useful reminder that "data center" doesn't automatically mean "crisis," even in a drought year.
The Bottom Line
Nationally, this isn't the resource apocalypse the loudest posts describe. The country has roughly eight times more renewable freshwater than it currently withdraws for every use combined, and even the most aggressive 2030 projections for data centers keep them under 1.5% of that picture. That part of the myth is bustable, cleanly, with public data.
Locally, the ten places above show a different, equally true picture: Loudoun County, Fayette County, Reno, Bluffdale, Tucson, Memphis, The Dalles, Altoona, and drought-stricken North Carolina are not experiencing a rounding error. They're experiencing double-digit percentages of their own water budgets, in several cases during active drought, decided by permitting boards most residents have never attended a meeting for. Both of those sentences are true on the same day, describing the same industry, the same way "Two Curves" showed that AI's efficiency story and AI's environmental-cost story are both real and both incomplete on their own.
The efficiency curve adds one more honest wrinkle nobody's fully reckoned with yet: AI-native liquid cooling is quietly solving the water-efficiency problem the traditional industry left alone for a decade, faster than anyone expected, purely because physics demanded it. But a better ratio times a much bigger number can still equal a bigger absolute draw, and that's exactly the math the industry, and its critics, need to be running before either side declares victory.
If we want serious conversations about this, on either side, we need the local number and the national number in the same sentence, not one standing in for the other.
Seeing this pattern inside your own team? Find out where you actually stand: take the free AI Readiness Assessment. Two minutes, no sales pitch, and you get a clear picture of your next step.
Sources & Further Reading
National Water Resources
- U.S. Geological Survey. "Estimated Use of Water in the United States in 2015." Circular 1441. Source of the 322 billion gallons per day total withdrawal and 281 billion gallons per day freshwater figures.
- FAO AQUASTAT / World Bank. "Renewable Internal Freshwater Resources, Total." Source of the 3,069 billion cubic meter (roughly 811 trillion gallon) U.S. renewable freshwater baseline and the 12.3% North American water stress figure.
Data Center Inventory and Capacity
- Statista. "Data Centers Worldwide by Territory," April 2026 update.
- dcmap.us. U.S. Data Center Map and Policy Tracker, July 2026 data.
- Cleanview. U.S. Data Center Project List and Tracker, July 2026 data.
- Synergy Research Group. "Hyperscale Data Center Count Hits 1,136" and related quarterly hyperscale capacity reports, 2025 to 2026.
- Federal Energy Regulatory Commission. "State of the Markets," March 2026.
Efficiency Research: PUE and WUE
- Uptime Institute. Global Data Center Survey, 2007 through 2024. Source of the PUE history already cited in "A Tale of Two Curves."
- Patterson, M. (2011). "Water Usage Effectiveness (WUE): A Green Grid Data Center Sustainability Metric." The Green Grid, White Paper #35.
- Shehabi, A., et al. (2016). Lawrence Berkeley National Laboratory data center water study establishing the 1.8 L/kWh U.S. average WUE baseline.
- Company sustainability disclosures: Amazon Web Services, Microsoft, Meta, and Google fleet and regional WUE figures, 2024 to 2026 reporting.
Current and Projected Water Consumption
- Shehabi, A., et al. (2024). 2024 United States Data Center Energy Usage Report. Lawrence Berkeley National Laboratory, LBNL-200163.
- Han, Y., Li, P., Wierman, A., & Ren, S. (2026). "Small Bottle, Big Pipe: Quantifying and Addressing the Impact of Data Centers on Public Water Systems." UC Riverside, Caltech, and Rochester Institute of Technology. arXiv:2603.02705.
- Bluefield Research. "The Water-Power Nexus: How Data Centers Are Reshaping the U.S. Water Landscape," February 2026.
- American Water Works Association. "Cooling the Cloud: Water Utilities in a Data-Driven World," October 2025.
State and Local Reporting (The Ten Places)
- Loudoun Water; Sierra Club Virginia; Frontier Group; Bay Journal Chesapeake data center series, 2025 to 2026.
- Fortune; Bloomberg Law; WRDW/WALB Georgia local news, on Fayette and Newton County water disclosures, May 2026.
- Houston Advanced Research Center. "Thirsty Data and the Lone Star State," January 2026.
- Desert Research Institute; Nevada Current; This Is Reno; Sierra Nevada Ally; Colorado Public Radio Mountain West News Bureau, on Tahoe-Reno Industrial Center water demand, 2026.
- Salt Lake Tribune and Grist reporting on NSA Bluffdale and Aligned Data Centers water use, 2025 to 2026.
- Pima County Department of Environmental Quality violation notice; Microsoft regional WUE disclosures, on Arizona, May 2026.
- Memphis Flyer; Governing; Protect Our Aquifer; Wikipedia (Colossus data center); Waterways Journal, on xAI Colossus water use, 2025 to 2026.
- Columbia Insight; WaterWatch; Sierra Club Oregon; Associated Press, on Google's The Dalles water disclosures, 2021 to 2026.
- Business Record; Inside Climate News; Iowa Geological Survey; WDMWW, on West Des Moines, Altoona, and Council Bluffs, 2025 to 2026.
- WRAL; WUNC; Catawba County government statement, on North Carolina drought and data center water use, 2026.
Companion Articles from Understanding Your AI
- Does AI Really Use 10 Gallons of Water Per Image?
- A Tale of Two Curves: AI Data Centers vs. Traditional Computing
Where does your team actually stand with AI?
Stop guessing. The free AI Readiness Assessment takes a few minutes and gives Tim what he needs to point you at your highest-value next step, whether or not you ever hire us. We serve Midland, Bay City, Saginaw, and Michigan's Great Lakes Bay Region with research-backed AI training and fractional AI leadership.
Start the Free AI Readiness Assessment | Book a 20-Minute Call